What is analytics and why we need it
Analytics is the systematic analysis of data to gather insights in specific research questions. Each time we want to understand something, we normally gather data and use it to answer questions we may have or to make decisions.
We look at the weather outside the window and decide if we want to take the umbrella or not, or which shoes are the most suited. Humans perform analysis and deductive reasoning without even noticing most of the time. Data without analytics is like having fuel without a car. It is not useful and simply a waste of time.
Thus one of our main concerns in this project was to give the right weight to analytics from the beginning, and include it in all the project phases. Only so, we will be able to answer the questions we have posed ourselves in a scientifically sound way.
Data without analytics is like having fuel without a car !
Analytics in Surveys
Normally surveys, and you surely have participated in one or more, are a sequential set of questions, one coming after the other. Typically, to keep the interpretation simple, questions have little to none correlation with one another. So the data analysis is normally not complicated and just looking at the answers separately is enough.
Something to note is that the right choice of participants is fundamental to avoid introducing bias. If the participants are only male, we will clearly have a strong bias, and we will not be able to gather interesting information that will reflect what women think, for example. A lot of effort typically goes in making sure that the participant choice has no bias that could be relevant to the questions one is trying to answer (the same number of male and female, same number of participants in all age groups, etc.).
In this project we are looking at bias very seriously to make sure that our conclusions are as bias-free as possible and are looking at different ways of achieving that with experts.
The challenges for Analytics in Storytelling
Using storytelling to build a survey, or in other words allowing participants to decide how the story and therefore the survey will develop, makes the classical approach to statistical analysis of surveys much less useful. In this project we are developing new analysis approaches to be able to understand how the different choices are related to each other, and how to use this correlation to understand the opinions of the participants on different topics. Adding a context to the questions (the story) allows us to formulate really specific questions to ask the participants.
In this new paradigm, not only the questions are important, but (and perhaps even more) also how they are connected. The entire story becomes a tree that a participant can navigate through. The new analysis methods that we are developing will make it possible to analyse this tree navigation and what this tells us about the opinions of participants. In the Figure below you can see a schematic image of a possible story with five questions.
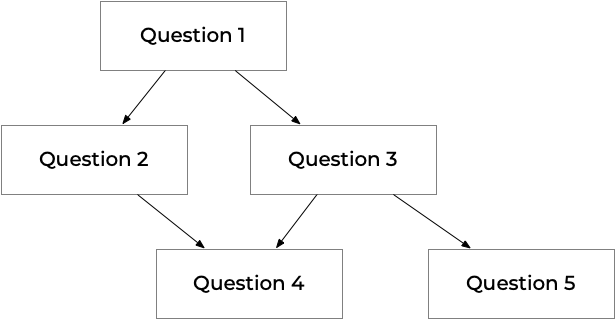
Different participants will see different questions and will be faced with different choices. A correct analysis of what happens during the story is mandatory to be able to interpret accurately the results. As you can see in the Figure a participant can get to Question 4 in two different ways. So the path to a point becomes suddenly very important and contains important information that needs to be decoded to interpret the participant’s opinion. This added layer of complexity requires new analysis methods that are being developed in this project.
Let’s start the experience to discover your profile !
Credits:
Umberto Michelucci, TOELT LLC, umberto.michelucci@toelt.ai
Prof. Aya Kachi, Università Basilea, aya.kachi@gmail.com